Database Limits for 11gR2
Each Oracle datafile can contain maximum 4194303 (4 Million) data blocks. So maximum file size is 4194303 multiplied by the database block size.
Block Size | Maximum Datafile Size
——————————————--
2k 4194303 * 2k = 8 GB
4k 4194303 * 4k = 16 GB
8k 4194303 * 8k = 32 GB
16k 4194303 * 16k = 64 GB
32k 4194303 * 32k = 128 GB
In Oracle Database 10g, BIGFILE tablespace was introduced. The BIGFILE tablespace can ONLY have a single datafile, but this datafile can contain maximum 4294967295 (4 billion) data blocks.
Block Size | Maximum Datafile Size
——————————————--
2k 4294967295 * 2k = 8 TB
4k 4294967295 * 4k = 16 TB
8k 4294967295 * 8k = 32 TB
16k 4294967295 * 16k = 64 TB
32k 4294967295 * 32k = 128 TB
Block Size | Maximum Datafile Size
——————————————--
2k 4194303 * 2k = 8 GB
4k 4194303 * 4k = 16 GB
8k 4194303 * 8k = 32 GB
16k 4194303 * 16k = 64 GB
32k 4194303 * 32k = 128 GB
In Oracle Database 10g, BIGFILE tablespace was introduced. The BIGFILE tablespace can ONLY have a single datafile, but this datafile can contain maximum 4294967295 (4 billion) data blocks.
Block Size | Maximum Datafile Size
——————————————--
2k 4294967295 * 2k = 8 TB
4k 4294967295 * 4k = 16 TB
8k 4294967295 * 8k = 32 TB
16k 4294967295 * 16k = 64 TB
32k 4294967295 * 32k = 128 TB
When you select the "Enterprise Edition" option during Oracle installation, all the components which are licensed under "Enterprise Edition" get installed by default. The idea is to install all these options and then disable those options that were not licensed.
If you need additional functionality such as partitioning some time after the initial installation, you can enable (or disable) the specific component functionality at the binary level:
1. Shutdown all database instance(s)/service(s) running from the Oracle Database Home
2. Run the following relink command to disable the option at the binary level:
make -f ins_rdbms.mk option_switch ioracle
cd $ORACLE_HOME/rdbms/lib
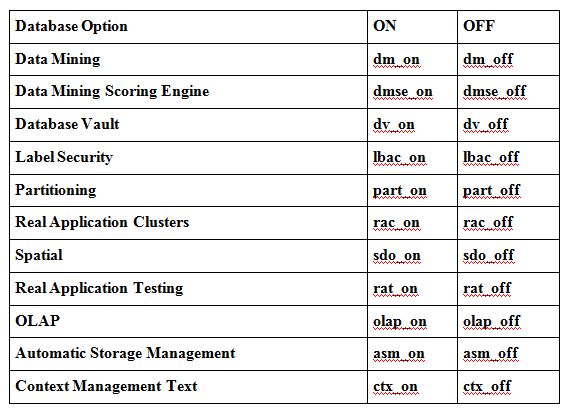
make -f ins_rdbms.mk part_off ioracle
Here is the list of database options and switches:
Startup the instance and check if the option is enabled:
SELECT * FROM v$option WHERE parameter = 'Partitioning';
The vmstat helps you to identify bottlenecks on your server. It displays real-time performance information about processes, memory, paging, disk I/O, and CPU usage.
Here’s sample output (Oracle Linux 5.6):
vmstat
procs ----------memory---------- --swap-- ----io---- --system-- -----cpu-----
r b swpd free buff cache si so bi bo in cs us sy id wa st
0 0 0 339904 74636 440928 0 0 67 25 108 81 1 0 96 3 0
Descriptions of the columns:
r: The number of processes waiting for run time
b: The number of processes in uninterruptible sleep
swpd: Total virtual memory (swap) in use (KB)
free: Total idle memory (KB)
buff: Total memory used as buffers (KB)
cache: Total memory used as cache (KB)
si: Amount of memory swapped in from disk (KB/s).
so: Amount of memory swapped to disk (KB/s).
bi: Blocks received from a block device (blocks/s).
bo: Blocks sent to a block device (blocks/s).
in: The number of interrupts per second, including the clock.
cs: The number of context switches per second.
us: User-level code time as a percentage of total CPU time
sy: System-level code time as a percentage of total CPU time
id: Idle time as a percentage of total CPU time.
wa: Time spent waiting for IO.
st: Time stolen from a virtual machine.
If you need additional functionality such as partitioning some time after the initial installation, you can enable (or disable) the specific component functionality at the binary level:
1. Shutdown all database instance(s)/service(s) running from the Oracle Database Home
2. Run the following relink command to disable the option at the binary level:
make -f ins_rdbms.mk option_switch ioracle
cd $ORACLE_HOME/rdbms/lib
make -f ins_rdbms.mk part_off ioracle
Here is the list of database options and switches:
Startup the instance and check if the option is enabled:
SELECT * FROM v$option WHERE parameter = 'Partitioning';
The vmstat helps you to identify bottlenecks on your server. It displays real-time performance information about processes, memory, paging, disk I/O, and CPU usage.
Here’s sample output (Oracle Linux 5.6):
vmstat
procs ----------memory---------- --swap-- ----io---- --system-- -----cpu-----
r b swpd free buff cache si so bi bo in cs us sy id wa st
0 0 0 339904 74636 440928 0 0 67 25 108 81 1 0 96 3 0
Descriptions of the columns:
r: The number of processes waiting for run time
b: The number of processes in uninterruptible sleep
swpd: Total virtual memory (swap) in use (KB)
free: Total idle memory (KB)
buff: Total memory used as buffers (KB)
cache: Total memory used as cache (KB)
si: Amount of memory swapped in from disk (KB/s).
so: Amount of memory swapped to disk (KB/s).
bi: Blocks received from a block device (blocks/s).
bo: Blocks sent to a block device (blocks/s).
in: The number of interrupts per second, including the clock.
cs: The number of context switches per second.
us: User-level code time as a percentage of total CPU time
sy: System-level code time as a percentage of total CPU time
id: Idle time as a percentage of total CPU time.
wa: Time spent waiting for IO.
st: Time stolen from a virtual machine.
